
Building a SOC Analyst Home Lab with Wazuh, Suricata, and the ELK Stack
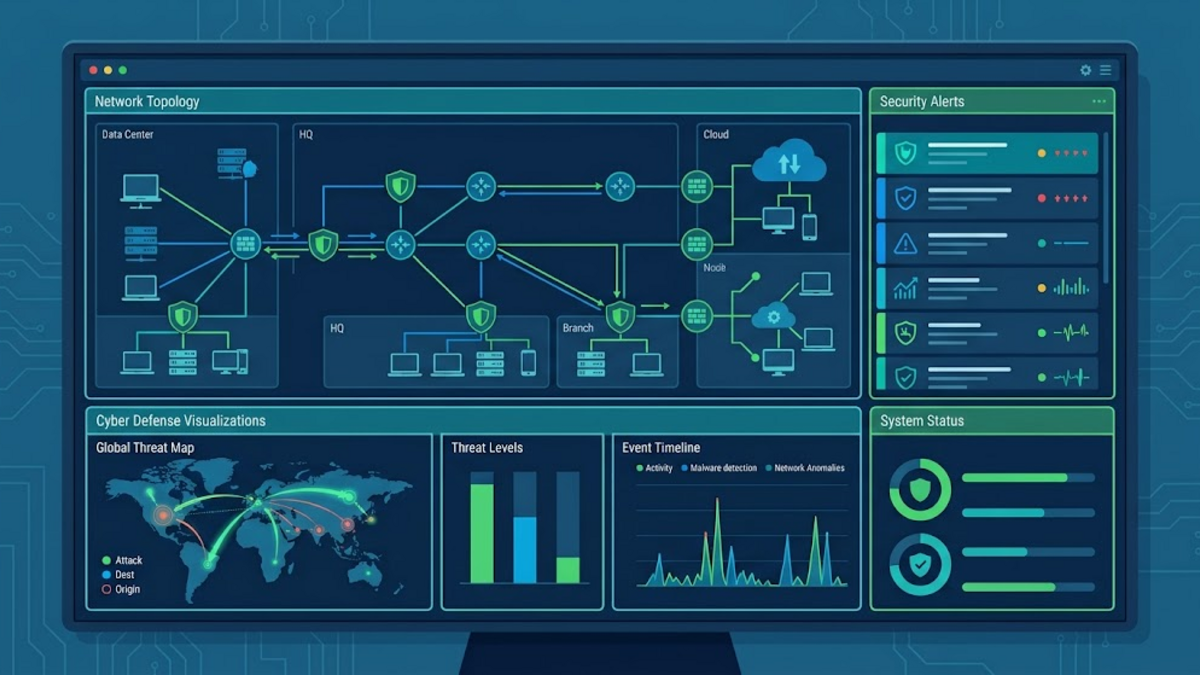
If you've ever wanted to practice threat hunting, incident response, or security monitoring without risking your production network, a SOC analyst home lab is exactly what you need. Think of it as a flight simulator for cybersecurity — you get to experience real attacks, real alerts, and real investigations in a sandboxed environment that won't get you fired or sued.
In this guide, I'll walk you through building a fully functional SOC (Security Operations Center) home lab using three powerful open-source tools: Wazuh for intrusion detection and compliance monitoring, Suricata for network traffic analysis, and the ELK Stack (Elasticsearch, Logstash, Kibana) for log management and visualization. By the end, you'll have a setup that mirrors what real SOC teams use every day.
Why Build a SOC Home Lab?
Most cybersecurity certifications — from CompTIA Security+ to CEH to BTL1 — expect you to understand how security tools work in practice, not just in theory. A home lab lets you:
- Generate and analyze real attack traffic (Metasploit, Nmap, etc.)
- Write custom detection rules and see them fire in real time
- Practice triaging alerts and building investigation workflows
- Build a portfolio project that stands out on job applications
The investment is minimal — an old laptop or a small VPS with 8GB+ RAM will do. The return is enormous: hands-on experience that separates you from candidates who only have textbook knowledge.
Architecture Overview
Here's the layout we're building. Imagine your home network as a small city: the ELK Stack is the central police station collecting reports, Wazuh is the security guard watching doors and windows on each building, and Suricata is the surveillance camera system monitoring all traffic on the streets.
┌─────────────────────────────────────────────────┐
│                 SOC HOME LAB                    │
│                                                 │
│  ┌───────────┐   ┌────────────┐   ┌──────────┐ │
│  │  Wazuh    │──▶│  Logstash  │──▶│  Elastic │ │
│  │  Agent(s) │   │  Pipeline  │   │  search  │ │
│  └───────────┘   └────────────┘   └────┬─────┘ │
│                                        │       │
│  ┌───────────┐   ┌────────────┐        │       │
│  │ Suricata  │──▶│   Filebeat │────────┘       │
│  │  (IDS/IPS)│   └────────────┘                │
│  └───────────┘                  ┌──────────┐   │
│                                 │  Kibana  │   │
│  ┌───────────┐                  │Dashboard │   │
│  │  Target   │                  └──────────┘   │
│  │  Machine  │                                 │
│  └───────────┘                                 │
└─────────────────────────────────────────────────┘
The key insight is that Wazuh and Suricata are data sources, while the ELK Stack is the analysis platform. Alerts flow from the sensors into a centralized place where you can search, correlate, and visualize them.
Step 1: Setting Up the ELK Stack
The ELK Stack is the backbone of our lab. We'll run it in Docker to keep things clean and reproducible. Create a directory and a Docker Compose file:
mkdir -p ~/soc-lab && cd ~/soc-labCreate a docker-compose.yml with Elasticsearch, Logstash, and Kibana. For a home lab, a single-node Elasticsearch cluster is sufficient. Allocate at least 4GB of heap memory to Elasticsearch if your machine has 8GB RAM total:
version: '3.8'
services:
  elasticsearch:
    image: docker.elastic.co/elasticsearch/elasticsearch:8.14.0
    environment:
      - discovery.type=single-node
      - xpack.security.enabled=false
      - "ES_JAVA_OPTS=-Xms4g -Xmx4g"
    ports:
      - "9200:9200"
    volumes:
      - es-data:/usr/share/elasticsearch/data

  logstash:
    image: docker.elastic.co/logstash/logstash:8.14.0
    volumes:
      - ./logstash/pipeline:/usr/share/logstash/pipeline
    ports:
      - "5044:5044"
    depends_on:
      - elasticsearch

  kibana:
    image: docker.elastic.co/kibana/kibana:8.14.0
    ports:
      - "5601:5601"
    depends_on:
      - elasticsearch

volumes:
  es-data:
Start the stack with docker compose up -d and wait a few minutes for Elasticsearch to initialize. You can verify it's running with:
curl -s http://localhost:9200/_cluster/health?prettyIf you see "status": "green" or "status": "yellow", you're good. Yellow is normal for a single-node cluster — it just means replicas can't be distributed across nodes.
Step 2: Installing Wazuh
Wazuh is a free, open-source security platform that combines intrusion detection, log analysis, file integrity monitoring, and compliance checking. Think of it as having a security guard who never sleeps, speaks every language, and remembers every rule you've ever given it.
The easiest way to run Wazuh is through their Docker-based installation. On your lab server:
git clone https://github.com/wazuh/wazuh-docker.git -b 4.9.0
cd wazuh-docker/single-node
docker compose up -d
This spins up the Wazuh manager, indexer, and dashboard. Access the dashboard at https://localhost:443 (default credentials: admin/admin — change them immediately).
Now install the Wazuh agent on your target machine (the "victim" machine in your lab). On a Debian/Ubuntu target:
curl -sO https://packages.wazuh.com/4.9/wazuh-agent_4.9.0-1_amd64.deb
sudo WAZUH_MANAGER='your-lab-server-ip' dpkg -i ./wazuh-agent_4.9.0-1_amd64.deb
sudo systemctl enable wazuh-agent
sudo systemctl start wazuh-agent
Within minutes, you'll see the agent appear in the Wazuh dashboard. It automatically begins monitoring for rootkits, examining log files, checking file integrity, and detecting anomalies. The beauty of Wazuh is that it comes with hundreds of out-of-the-box rules — no need to write detection logic from scratch.
Step 3: Deploying Suricata
Suricata is a high-performance Network IDS, IPS, and Network Security Monitoring engine. While Wazuh watches individual hosts, Suricata sits at the network level and inspects every packet flowing through your lab network.
Install Suricata on a machine with access to your lab's network traffic (ideally a span port or inline position):
sudo add-apt-repository ppa:oisf/suricata-stable
sudo apt update && sudo apt install suricata -y
sudo suricata-update
sudo suricata-update update-sources
Edit /etc/suricata/suricata.yaml and set the af-packet interface to match your lab network interface (e.g., eth0). Suricata uses the ET Open ruleset by default — over 30,000 rules covering everything from malware callbacks to SQL injection attempts:
sudo systemctl enable suricata
sudo systemctl start suricata
Suricata outputs logs in EVE JSON format, which is perfect for ingestion by the ELK Stack. Point Filebeat to /var/log/suricata/eve.json and create a Logstash pipeline to parse and index the events.
Step 4: Connecting Everything with Logstash and Filebeat
This is where the magic happens. Logstash acts as the central nervous system, collecting logs from Wazuh and Suricata, parsing them into structured data, and forwarding them to Elasticsearch.
Create a Logstash pipeline configuration at logstash/pipeline/soc-pipeline.conf:
input {
  beats {
    port => 5044
  }
}

filter {
  if [agent][name] == "suricata" {
    json {
      source => "message"
      target => "suricata"
    }
    if [suricata][event_type] == "alert" {
      mutate {
        add_tag => ["alert", "suricata"]
      }
    }
  }
}

output {
  elasticsearch {
    hosts => ["http://elasticsearch:9200"]
    index => "soc-lab-%{+YYYY.MM.dd}"
  }
}
On your Suricata machine, install Filebeat and configure it to ship EVE logs to Logstash. On your Wazuh manager, the Wazuh indexer already handles log storage, but you can forward alerts to ELK for unified dashboards.
Step 5: Building Dashboards in Kibana
Kibana is where all your data becomes visual and actionable. Once logs start flowing in, create index patterns for soc-lab-* and start building dashboards. Here are the essential ones:
- Alert Overview — Total alerts over time, broken down by severity and source (Wazuh vs Suricata)
- Network Traffic — Top talkers, protocol distribution, geographic map of destination IPs
- Threat Feed — Alerts correlated with known malicious IPs from threat intelligence feeds
- Agent Health — Status of all Wazuh agents, file integrity changes, compliance scores
Kibana's Lens editor makes building these visualizations straightforward — drag and drop fields, choose chart types, and save. The goal is a single pane of glass where you can see your entire security posture at a glance.
Step 6: Generating Attack Traffic for Practice
A SOC lab without attacks is like a gym without weights. You need to generate malicious traffic so your tools have something to detect. Here are some safe ways to do it:
# Nmap service scan against your target (triggers Suricata rules)
nmap -sV -sC target-ip

# Generate DNS tunneling traffic (triggers DNS-based detection)
# Use iodine or dnscat2 in your lab network

# Simulate brute-force SSH (triggers Wazuh auth failure rules)
hydra -l admin -P /usr/share/wordlists/rockyou.txt ssh://target-ip

# Run a vulnerable web app like DVWA for web attack detection
docker run --rm -it -p 80:80 vulnerables/web-dvwa
After each attack, check your Kibana dashboards. You should see new alerts appearing within seconds. This feedback loop — attack, detect, investigate, refine rules — is exactly what real SOC analysts do daily.
Tips for Getting the Most Out of Your Lab
Start small and iterate. Don't try to deploy everything on day one. Get ELK running first, then add Wazuh, then Suricata. Each tool has a learning curve, and stacking three new systems simultaneously is a recipe for frustration.
Use snapshots. If you're running this on a VPS or virtual machine, take a snapshot before each major change. Breaking things is part of learning — snapshots let you break things without consequences.
Document your findings. Create a GitHub repository and write up your investigation process for each attack scenario. This becomes invaluable for job interviews — you can literally walk a hiring manager through your thought process with real evidence.
Join the community. The Wazuh Slack, Elastic discuss forums, and Suricata Issue tracker are all active with practitioners who've solved problems you'll encounter. Don't struggle in silence when the answer is a message away.
Conclusion
Building a SOC analyst home lab is one of the highest-ROI investments you can make in a cybersecurity career. You get hands-on experience with enterprise-grade tools, practice that maps directly to certification objectives, and a portfolio project that proves you can do the work — not just talk about it.
The combination of Wazuh, Suricata, and the ELK Stack gives you coverage across host-based detection, network monitoring, and centralized log analysis — the three pillars of any real SOC. Start with what you have, grow as you learn, and remember: every expert was once a beginner who decided to set up a lab instead of just reading about tools.
Got questions or built your own lab? Drop a comment below — I'd love to hear what you're working on.